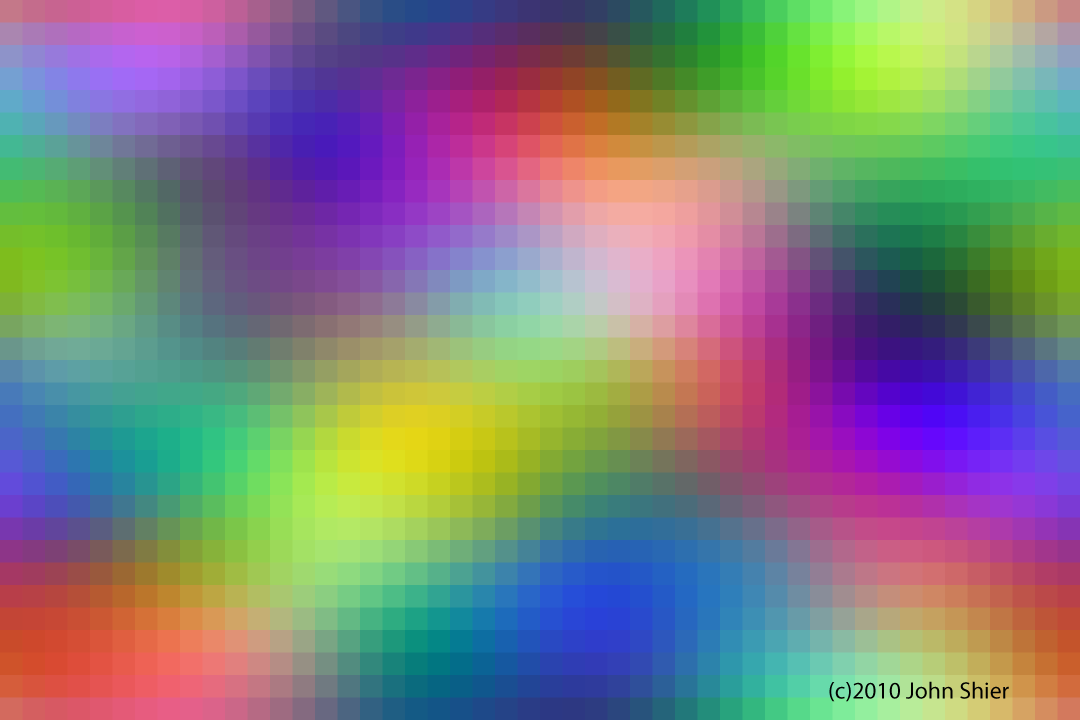
This image can be viewed as a sort of 3-dimensional "color wheel". Traditional color wheels have 6 or 12 colors, usually with about the same "saturation" and "value". This fails to show what happens when saturation and value vary. The image can also be thought of as a 2-dimensional "rainbow"
The image shows "adjacencies" in color space. If you choose a red square and look at its surroundings you see colors which are adjacent in color space. The closer two colors are in the image, the closer they are in color space. All levels of saturation and value are possible (but due to the randomness used in generating a given image, not all of them will occur).
Scroll down for more comments on this image.
This image differs from image 5 in that the amplitudes of the waves are now dependent on the wavelength. The short-wavelength waves have lower amplitude, so that one sees more of the long wavelenths. The average values of the coefficients fall off as the inverse 2.0 power of the wavelength. It can be seen that the feature sizes are somewhat bigger, and the changes smoother than in image 8. As chance would have it, the particular set of (random) coefficients chosen gives many bright colors.
The discerning viewer will see that this image is "periodic" along both axes -- something that arises from the way it is constructed.
The borders between squares appear to have dark bands along them. This is a well-known illusion that occurs at a color "step".
Prints are available on a custom basis. Also mugs. See main page.